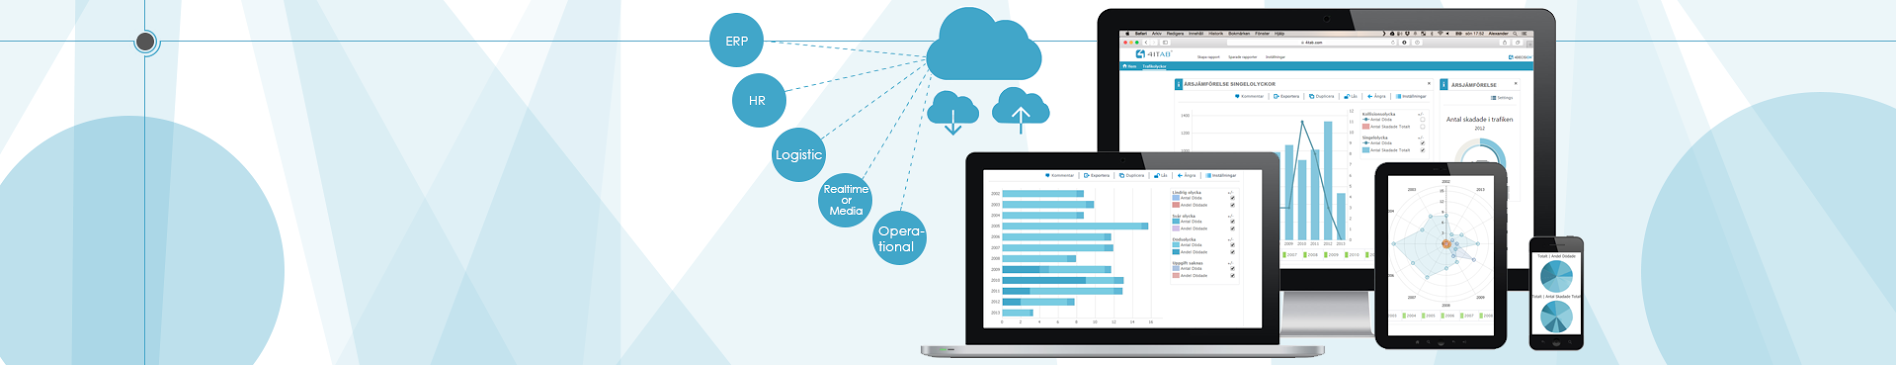
Use our indicators and gauges to build your company's analysis tools. Mainly to quickly evaluate which the most successful business processes are and which one of those who require attention. The simplest form of analyses is that your companies KPIs indicates that something is wrong. You can then drill down into the underlying information to find the cause of the problem in general. By determining the cause, the company can quickly prevent the risk that the problem would arise again. 4DECISION gives in this case the appropriate interface and tools needed to users at different levels in the organization. Analyses are then used to control, optimize and automate decision making. Therefore, it is an advantage if the data is visualized in a useful and understandable manner. Data Visualization is the process that maps data to images. The images include charts, tables, graphs and other visual elements where the information appears. 4DECISION provides the ability to analyse a complete 360 degree view of a company